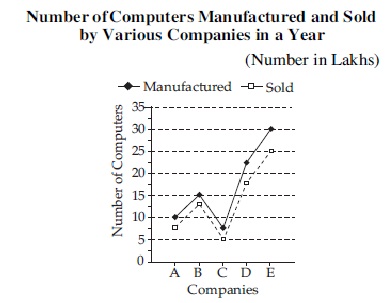
Graphical Data Interpretation Set-3
Hello Readers,
Data Interpretation Questions are very important in every competitive examination. This set is based on questions on graphical representation of data. We will be updating you with all type of Data Interpretation Questions on a daily basis.
 1. What is the respective ratio of the number of Computers manufactured by Companies A and C together to the number of Computers sold by Companies A and C together ?
(A) 4 : 5
(B) 14 : 11
(C) 8 : 9
(D) 7 : 5
(E) None of these
2. What is the difference between the average number of Computers manufactured by all the Companies together and the average number of Computers sold by all the Companies together ?
(A) 3500
(B) 35000
(C) 350000
(D) 3500000
(E) None of these
3. The number of Computers sold by Company B are what percent of the number of Computers manufactured by Company B ? (Rounded off to two digits after decimal)
(A) 83·33
(B) 120
(C) 78·83
(D) 106·54
(E) None of these
4. The number of Computers manufactured by Company D are what per cent of the number of Computers manufactured by Company E ?
(A) 125
(B) 112·5
(C) 85
(D) 65·25
(E) 75
5. The number of Computers manufactured by Company B are approximately what percent
of the number of Computers manufactured by all the Companies together ?
(A) 22
(B) 18
(C) 14
(D) 26
(E) 32
Answers:
- D
- C
- A
- E
- B
[do_widget text]


