Data Chart Based Di Questions Set 3
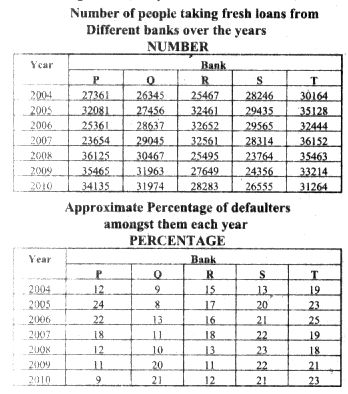
Study the following table carefully and answer the questions carefully
Number of people taking fresh loans from different Banks over the years and the percentage of defaulters amongst them each year

1. Approximately how many people taking a loan from bank S in year 2006 were defaulters
A) 6490
B) 6210
C) 5020
D) 6550
E) 5580
2. Approximately what is the difference between the defaulters between the number of defaulters of bank Q in the year 2004 and 2005
A) 175
B) 125
C) 190
D) 205
E) 140
3. In which of the following years was the no of defaulters in bank R, the maximum among the given years
A) 2005
B) 2006
C) 2007
D) 2010
E) None of these
4. In which of the following years the difference in the number of people taking loan from bank P from the previous year the highest
A) 2008
B) 2006
C) 2007
D) 2005
E) None of these
5. Approximately what was the total number of defaulters of bank T in the years 2007 and 2008 together
A) 14110
B) 13620
C) 13250
D) 14670
E) 15330
Answers:
1) B
2) A
3) C
4) D
5) C


