Data Chart Based DI Questions 2
| Get Regular Updates On a Daily Basis
[wysija_form id=”1″] |
[do_widget “Recent Posts”] |
Hello Readers,
Chart based data interpretation Questions are very important in every competitive examination. You can easily find a set of such questions in every examination.
This set is based on questions on a given set of information, which are to be solved on basis of given statements. We will be updating you with all type of such questions on a daily basis. This set is based on a word formation pattern.
Chart Based Data Interpretation Questions

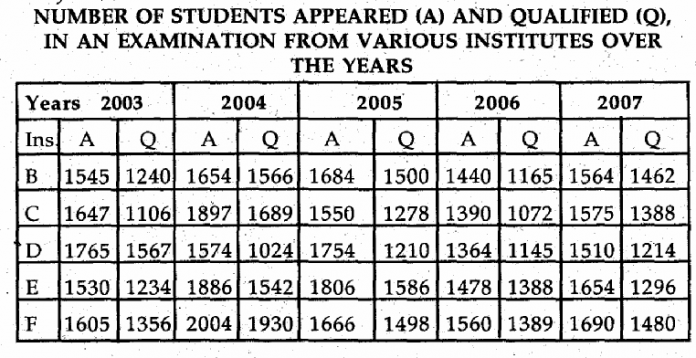
Study the following table and answer the questions that follow.
- What is the difference between the number of students appeared but not qualified in the exam from institute B in the year 2004 and the number of students appeared but not qualified in the exam from the same institute in the year 2006?
A) 187
B) 88
C) 275
D)373
E)None of these
- What is the approximate average number of candidates appeared for the exam from institute E over the years
A) 1759
B) 1586
C) 1671
D)1924
E) None of these - Percentage of candidates qualified over appeared from institute D is lowest in which of the following year.
A) 2003
B) 2004
C) 2005
D) 2006
E) None of these - What is the percentage of the candidates qualified over the number of candidates appeared for the exam in the year 2005 from all institutes together. (rounded off to two digits after decimal)
A) 92.34
B) 73.47
C) 66.94
D) 83.59
E) None of these
- Approximately what is the number of candidates qualified over appeared from all the institutes together in 2007?
A) 68
B) 55
C) 74
D) 92
E) 86
Answers:
1) A
2) C
3) B
4) D
5) E
[do_widget text]


