Data Interpretation Practice Set – 33
As Banking EXAMS like SBI PO, IBPS Clerical, IBPS PO and SSC CGL 2018 exam is on the way. So, for the practice of candidates here we are providing some questions of Data Interpretation practice set.
Directions (Q.1-5):
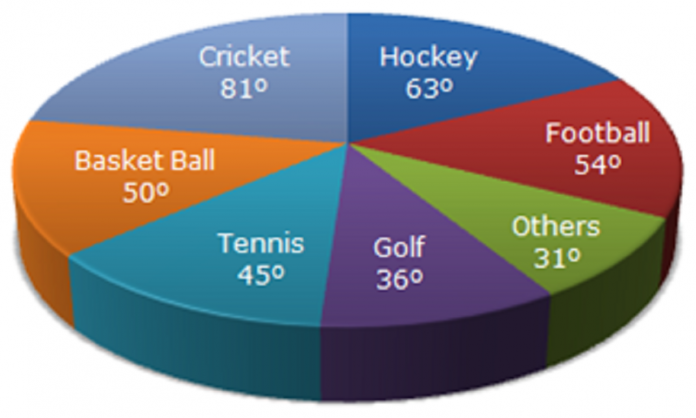
(1-5) The circle-graph given here shows the spendings of a country on various sports during a particular year. Study the graph carefully and answer the questions given below it.

1. What percent of total spending is spent on Tennis?
A. 25/2%
B. 25%
C. 45%
D. 45/2%
E. 40%
 2.How much percent more is spent on Hockey than that on Golf?
A. 27%
B. 35%
C. 37.5%
D. 75%
E. 70%
3.If the total amount spent on sports during the year be Rs. 1,80,00,000 , the amount spent on Basketball exceeds on Tennis by:
A. Rs. 2,50,000
B. Rs. 3,60,000
C. Rs. 3,75,000
D. Rs. 4,10,000
E. Rs. 5,00,000
4.How much percent less is spent on Football than that on Cricket?
A. 22%
B. 27%
C. 100/3%
D. 40%
E. 30%
5. If the total amount spent on sports during the year was Rs. 2 crores, the amount spent on Cricket and Hockey together was:
A. Rs. 8,00,000
B. Rs. 80,00,000
C. Rs. 1,20,00,000
D. Rs. 1,60,00,000
E. Rs. 1,50,00,000

