Graphical Data Interpretation Practice Set – 7
Here we are with the Graph Based Data Interpretation Practice Set for the various competitive exams as this plays an important part in every exam.
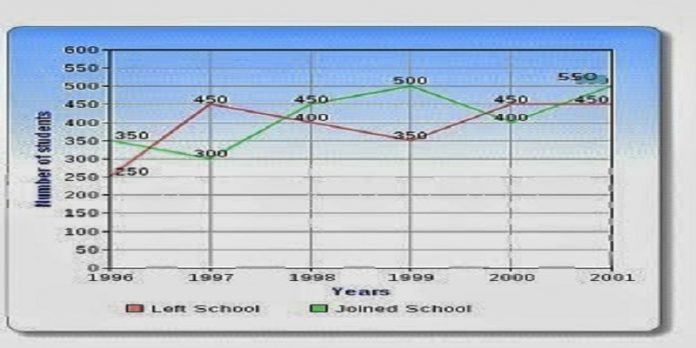
Study the following line graph which gives the number of students who joined and left the school in the beginning of the year for six years from 1996 to 2001.
Initial strength of the school in 1995 was 3000. Answer questions based on the line graph given below.

1. The strength of the school increased from 1997 to 1998 by what percent ?
(1) 1.7 % (2) 1.8 %
(3) 1.9 % (4) 2 %
(5) None of these
 2. The number of students studying in the school during 1999 was :
(1) 3100 (2) 3000
(3) 3150 (4) 3250
(5) None of these
3. During which of the following pairs of years, the strength of the school was same ?
(1) 1997 and 1998
(3) 1998 and 2000
(3) 1999 and 2001
(4) 1996 and 2000
(5) None of these
4. The number of students studying in the school in 1998 was what percent of the number of students studying in the school in 2001 ?
(1) 90.75 % (2) 91.75%
(3) 92.75% (4) 93.75%
5. Among the given years the largest number of students joined in which year ?
(1) 1999 (2) 2000
(3) 2001 (4) 1998
(5) None of these


